Analyze Logs
Data in the Azure Monitor logs is stored in a Log Analytics workspace, where it’s separated into tables, each with its own set of unique properties.
VM insights store the collected data in logs, and the insights provide performance and map views that you can use to interactively analyze the data. You can work directly with this data to drill down further or perform custom analyses. To analyze other log data that you collect from your virtual machines, use the log queries in Log Analytics. Several built-in queries for virtual machines are available to use, or you can create your own. You can interactively work with the results of these queries, include them in a workbook to make them available to other users, or generate alerts based on their results.
Alerts
Azure Monitor alerts proactively notify you when important conditions/issues are found in your monitoring data. These alerts can help you identify and address issues in your system before your customers notice them or have a big outage. You can set alerts on metrics, logs, and the activity log.
Create Alerts from the Azure Portal
The following procedure describes how to create a metric alert rule in the Azure portal:
\ 1.\ Log in to the Azure portal, and go to the session host on which you want to create the alert. Alternately, you can create an alert from Azure Monitor that consolidates all your monitoring settings and data in one view.
\ 2.\ Click Alerts, expand the “+ Create menu” item, and select “Alert rule.” See Figure 11-5.

Figure 11-5. Azure Monitor, adding an alert
\ 3.\ On the next page you will add the scope, condition, and actions. See Figure 11-6.
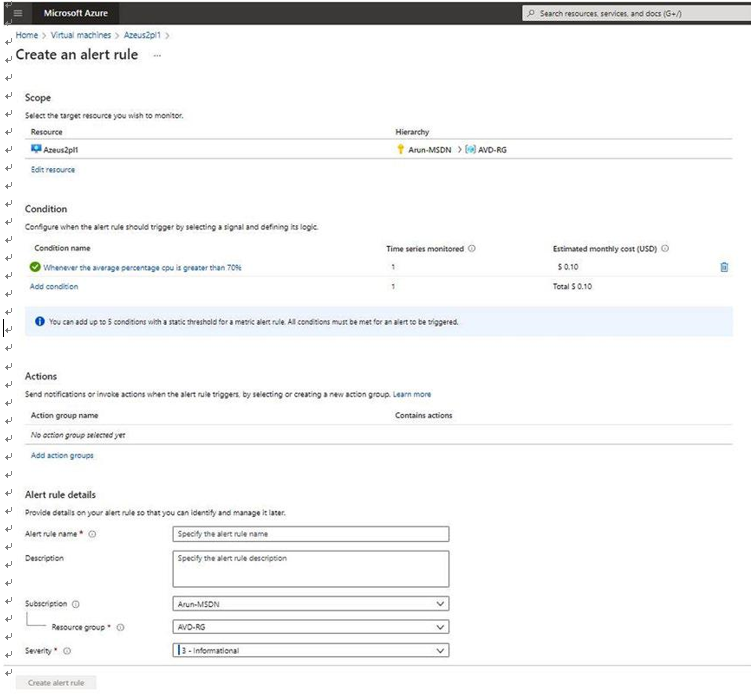
Figure 11-6. Azure Monitor, Add Alert page
The alert scope, condition, and action are part of alert creation page, so let’s see what exactly each represent.
What is an alert scope? The scope is the target resource(s) that you want to alert on. You can filter by subscription, by resource type, and by location drop-downs to find the resource you want to monitor. You can also use the search bar to find your resource. If the selected resource has metrics that you can create alert rules on, the available signal types on the bottom right will include metrics. Once you have selected a target resource, click Done. See Figure 11-7.
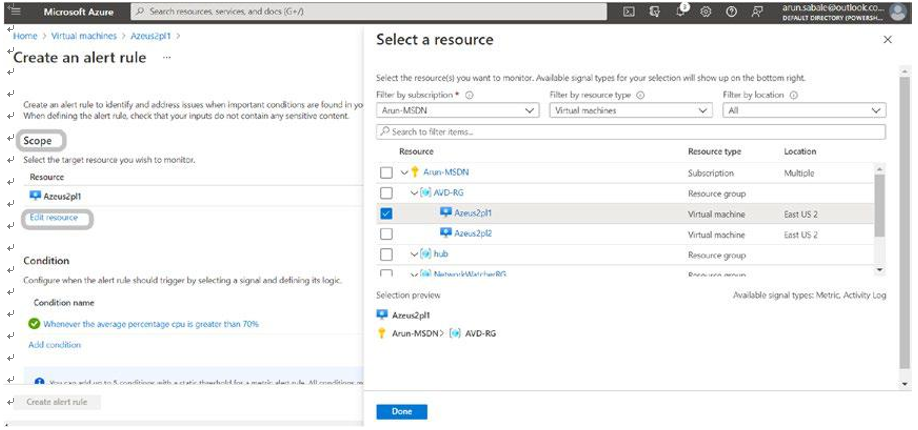
Figure 11-7. Azure Monitor, Scope option
What is an alert condition? Select the condition on which you want the alert to get triggered. Under the Condition option, you will see a list of signals supported for the resource. Select the metric you want to create an alert on. You will see a chart showing the metric’s behavior for the last six hours. Use the “Chart period” drop-down to see a longer history for the metric. If the metric has dimensions, you will see a dimensions table presented. Optionally, select one or more values per dimension. See Figure 11-8.

Figure 11-8. Azure Monitor, Condition option
•\ The displayed dimension values are based on metric data from the previous day.
•\ If the dimension value you’re looking for isn’t displayed, click “Add custom value” to add a custom dimension value.
•\ You can also choose “Select all current and future values” for any of the dimensions. This will dynamically scale the selection to all current and future values for the dimension.
The metric alert rule will evaluate the condition for all combinations of values selected.
Select the threshold type, operator, and aggregation type. This will determine the logic that the metric alert rule will evaluate.
•\ If you are using a Static threshold, continue to define a Threshold value. The metric chart can help determine what might be a reasonable threshold.
•\ If you are using a Dynamic threshold, continue to define the Threshold sensitivity. The metric chart will display the calculated thresholds based on recent data.
What are alert actions? You can define what actions and notifications are triggered when the alert rule generates an alert. You can add an action group to the alert rule either by selecting an existing action group or by creating a new action group. Proceed to the Details tab. Under Project details, select the subscription and resource group in which the alert rule resource will be saved. Under “Alert rule details,” specify the severity and alert rule name. You can also provide an alert rule description, select if the alert rule should be enabled when created and if it should automatically resolve alerts (which instructs the alert rule to maintain a state and not fire continuously if there’s already a fired alert on the same condition). See Figure 11-9.
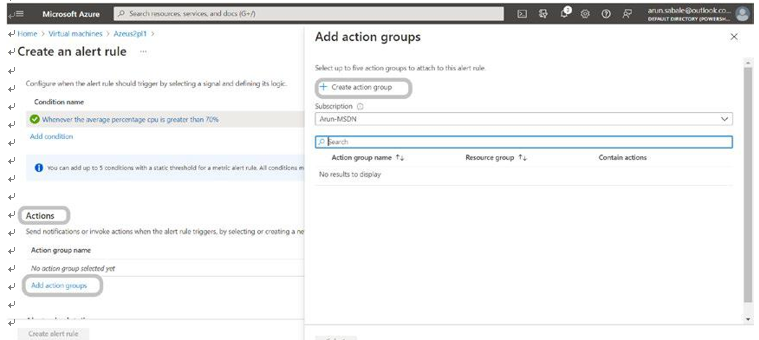
Figure 11-9. Azure Monitor, action groups
\ 1.\ Once you add the scope, condition, and action, then you can proceed further with the Tags tab, where you can set tags on the alert rule you’re creating.
\ 2.\ Proceed to the “Review + create” tab, where you can review your selections before creating the alert rule. A quick automatic validation will also be performed, notifying you in case any information is missing or needs to be corrected. Once you’re ready to create the alert rule, click Create.