Monitor Azure Virtual Desktop by Using Azure Monitor
Azure Monitor is a full-stack monitoring service that provides a complete set of features to monitor your Azure resources, including Azure Virtual Desktop. You don’t need to directly interact with Azure Monitor, though, to perform a variety of monitoring tasks, because its features are integrated with the Azure portal for the Azure services that it monitors.
When you have critical applications and business processes that rely on Azure resources, it’s important to monitor those resources for their availability, performance, and operation. Azure Virtual Desktop is an application used by multiple end users, so you must monitor and set up alerts for Azure Virtual Desktop.
Some services in Azure display customized monitoring experiences in Azure Monitor. These experiences are called insights, and they include prebuilt workbooks
and other specialized features for that service. Azure Virtual Desktop also provides a customized experience with insights, and you can customize them per your requirements.
There are two things you must enable monitoring for.
•\ Session host virtual machines
•\ Host pool diagnostic logs.
Let’s see why the session host monitor is important and what you can monitor.
Monitoring Virtual Machine Data
Azure virtual machines collect the same kinds of monitoring data as other Azure resources, which are described in the article “Monitoring Data from Azure Resources.” Azure Monitor provides a basic level of monitoring for Azure virtual machines at no cost and with no configuration. Platform metrics for Azure virtual machines include important metrics such as the CPU, network, and disk utilization with no additional configuration. You can onboard machines to VM insights, which deploys required agents and begins collecting data from the guest operating system. Follow these steps to enable insights on each session host:
\ 1.\ Log in to the Azure portal and go to the session host on which you want to enable insights.
\ 2.\ Click Insights on the left and then the Enable button.
See Figure 11-1.

Figure 11-1. Azure virtual machine insights
Once you enable the Insights option, then you will be able to see the performance, map, and health of the VM on the Insights page.
On the Performance tab, you can see the disk attached and its usage as well as its CPU usage. See Figure 11-2.
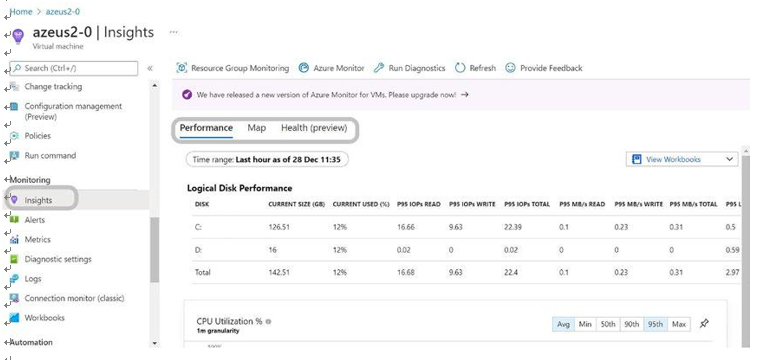
Figure 11-2. Azure virtual machine insights, Performance tab
On the second tab, Map, you can see the process running and the connection to remove the server/host with the port details. You can also see VM properties, log events, alerts, connections, and changes on the right. See Figure 11-3.
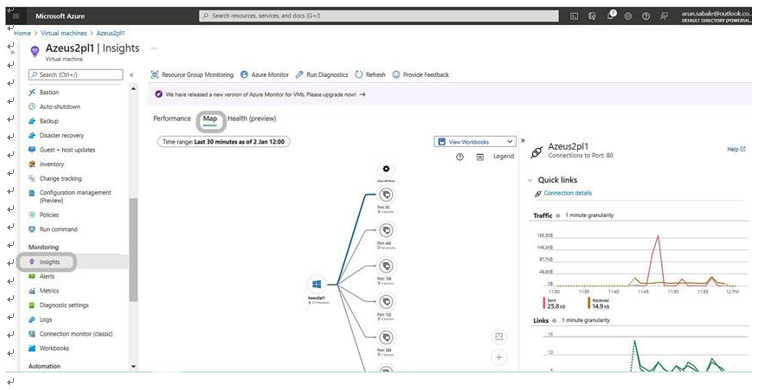
Figure 11-3. Azure virtual machine insights, Map tab
Additionally, VM monitoring can be done from the Overview page as well, and you can see all the key metrics on the Monitoring tab. This tab contains the CPU, network, memory, and disk usage for the last 30 days or less. See Figure 11-4.
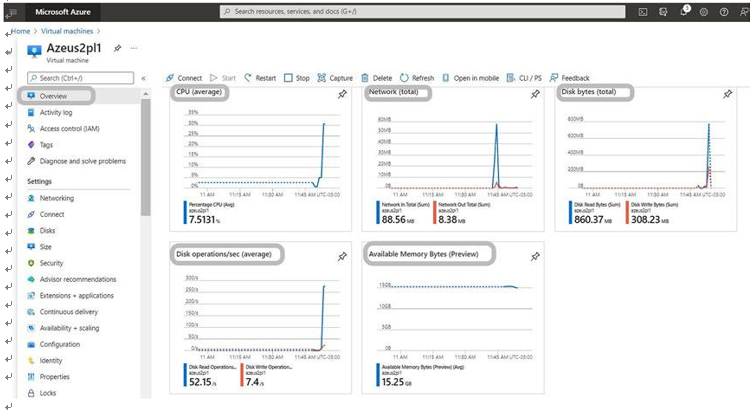
Figure 11-4. Azure virtual machine insights, Overview